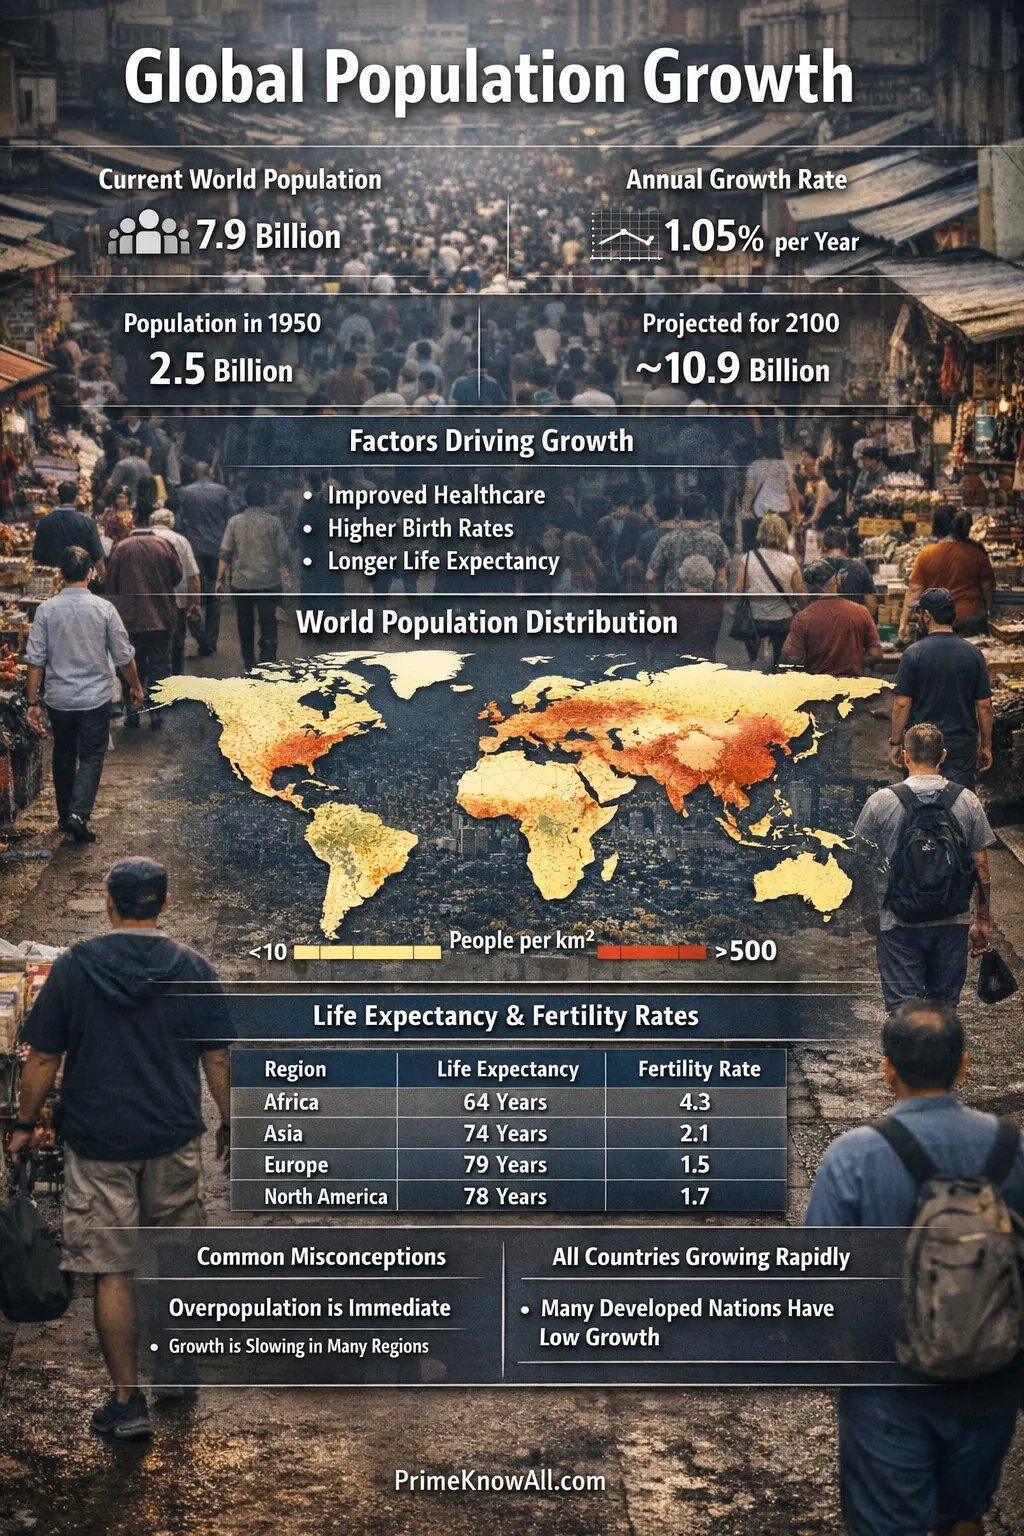
The 20-Second Answer
Population growth is the change in how many people live in a place over time, shaped by births, deaths, and migration. It can stay positive even when families have fewer children, because age structure (how many people are entering childbearing ages) keeps births high for a while.
What Matters Most In One Read
- Growth rate is a speed, not a moral judgement: it describes how fast headcount changes.
- Births minus deaths is only part of the story; net migration can dominate in some countries.
- Population momentum explains why growth can continue even after fertility falls.
- Replacement-level fertility is not a universal number; it varies with survival rates and sex ratios.
- The biggest forecasting errors come from assuming today’s fertility, mortality, or migration stays fixed.
Population growth isn’t “just more people.” It is a moving system where tiny shifts in births, deaths, and migration can add up, especially when the age profile is young.
A practical way to read any headline is to ask: Which lever moved (fertility, mortality, or migration), and what was the age structure when it moved? That pair usually explains the direction and the pace.
If you remember one thing… Treat population growth like a dashboard with four dials: births, deaths, net migration, and age structure. News often talks about only one dial.
What Population Growth Actually Means
Population growth means the net change in the number of people in a place across a period (a year, a decade, or longer). It can be positive, negative, or near zero, and each case can still hide big underlying shifts in births, deaths, and migration.
In plain terms, population growth rate, meaning the average percent change per year, is a speedometer for headcount. Two places can have the same rate while looking totally different day-to-day if one is driven by migration and the other by births.
- Natural increase, meaning births minus deaths, is a core component of growth.
- Net migration, meaning immigration minus emigration, is a second component that can outweigh natural increase.
- Age structure, meaning how many people are in childbearing ages, is a multiplier that can keep births high even if families are smaller.
The Three Engines: Births, Deaths, And Migration
Population change is powered by three measurable flows: fertility (births), mortality (deaths), and migration (movement). Most confusion comes from mixing the flows with the age structure that shapes how large each flow becomes.
Total fertility rate, meaning the average number of children a woman would have if current age-specific birth rates stayed the same, is a summary of childbearing patterns. Mortality is often tracked through life expectancy or age-specific death rates, while net migration captures how many more people arrived than left.

- Higher fertility tends to raise growth when a large share of the population is in reproductive ages.
- Lower mortality tends to raise growth when survival improves, especially in early life.
- Positive net migration can raise growth even if natural increase is small.
| Driver | What It Measures | What It Changes First | A Common Misread |
|---|---|---|---|
| Fertility | Birth patterns across ages (often summarized by TFR) | Number of births and future age structure | Confusing birth rate with fertility |
| Mortality | Survival at each age (often summarized by life expectancy) | Population size and the share of older ages | Assuming mortality shifts are always slow |
| Net Migration | Inflow minus outflow of people | Working-age share and short-run growth | Ignoring that migration can reverse quickly |
| Age Structure | How many people are in each age group | Birth totals even when fertility falls | Thinking “low fertility = instant decline” |
Pause And Lock It In
- Three engines move the total: births, deaths, migration.
- Age structure decides how powerful each engine feels.
- Same growth rate can hide very different realities.
How Growth Is Measured In Practice
Population growth can be described with a simple accounting identity, but the useful part is learning what each metric is good for. A clean measurement setup helps separate short-term noise from structural change.
- Annual growth rate, meaning percent change per year, is best for comparisons across places of different sizes.
- Doubling time, meaning how long it would take to double at a constant rate, is best as an intuition tool.
- Replacement-level fertility, meaning the fertility level that keeps a population stable in the long run without migration, is best as a benchmark, not a universal target.
A popular shortcut is the Rule of 70: doubling time (in years) is roughly 70 ÷ growth rate (in percent). It is an approximation, and it becomes less reliable when growth rates swing, migration shifts, or age structure changes quickly.
A Simple Example Without Heavy Math
If a country grows at about 1% per year and that rate stayed steady (a big “if”), the Rule of 70 suggests a doubling time near 70 years. If growth falls to 0.5%, doubling becomes about 140 years, which is why small-looking rate changes can reshape long-term projections.
- Use growth rate to compare countries.
- Use doubling time to visualize what a rate implies.
- Use benchmarks like replacement fertility to interpret direction, not destiny.
Demographic Transition: Why Growth Speeds Up Then Slows
Demographic transition, meaning the shift from high birth and death rates to lower birth rates and longer lives, is a model used to explain why many societies see a surge in growth before it gradually slows. It is a useful approximation, but it does not fit every place perfectly or on the same timeline.
The classic pattern begins when mortality declines faster than fertility, often due to improvements in survival and living conditions. Later, fertility usually declines as family size preferences and constraints change, which slows growth and shifts the population toward older ages.
- Stage pattern (simplified): high births/high deaths → deaths fall → births fall → low births/low deaths.
- Age shift: a “young-heavy” pyramid gradually becomes more balanced, then more “older-heavy.”
- Key caution: the model describes a broad tendency in many historical cases, not a guaranteed path.
A Useful Mental Shortcut
- When deaths drop first, growth tends to accelerate.
- When births drop later, growth tends to decelerate.
- Age structure decides how long the “lag” lasts.
Population Momentum: The Hidden Driver Many People Miss
Population momentum, meaning continued growth (or continued decline) caused by an existing age structure, explains why populations can keep growing even after fertility falls near replacement levels. A country with many young people will have many new parents, so births can remain high even if each family is smaller.
This is where headlines can mislead. A drop in fertility rate can signal a long-term slowdown, but the near-term population count may keep rising because a large cohort is moving through childbearing ages.
- Momentum is strongest when the population is very young.
- Momentum fades as age distribution stabilizes.
- Migration can amplify or offset momentum in some settings.
One Analogy That Actually Helps
Think of population growth like compound interest on a bank account: the “interest rate” is fertility and survival, but the principal is the age structure. Even if the rate drops, a large principal can still produce a lot of “interest” (births) for years.
Limits And Feedbacks: Why Growth Rarely Stays Exponential
Long-run exponential growth is uncommon because real populations face feedbacks from resources, health, education, and economic structure. These feedbacks do not work as a single “cap,” but as a set of interacting constraints and incentives that change how people live and plan families.
- Urbanization often changes the cost and logistics of raising children, which can influence fertility.
- Education, especially for girls and women, is frequently linked with later childbearing and smaller family size in many contexts.
- Healthcare and sanitation can reduce mortality, which can temporarily increase growth even if fertility is unchanged.
- Housing and jobs can affect migration flows, which may shift quickly with economic cycles.
It is safer to say that these factors often interact rather than claiming a single cause. The same policy or economic change can produce different outcomes depending on baseline age structure, local institutions, and timing.
What To Check Before Believing A Trend
- Is the change driven by fertility, mortality, or migration?
- What does the age structure look like right now?
- Is the headline describing a rate or a count?
Common Misconceptions About Population Growth
Population growth is easy to misunderstand because people mix up rates, counts, and timing. The quickest way to get clarity is to separate what is false from what is conditionally true.
- Misconception: “If fertility falls, the population will shrink right away.” Fix: It may still grow due to population momentum. Why it’s misread: People ignore age structure.
- Misconception: “Population growth rate tells you how many people were added.” Fix: Rate is a percent; the absolute increase depends on the starting size. Why it’s misread: Percent changes feel like counts.
- Misconception: “Migration is always a minor factor.” Fix: In some countries, net migration is the primary driver of change. Why it’s misread: Births and deaths are more visible in everyday life.
- Misconception: “Replacement-level fertility is always 2.1.” Fix: It varies with survival and sex ratios; 2.1 is a common approximation in high-survival contexts. Why it’s misread: A single number is easier to repeat than a range.
- Misconception: “Exponential growth is the default forever.” Fix: Feedbacks usually shift fertility, mortality, or migration over time. Why it’s misread: People extrapolate short trends too far.
- Misconception: “A stable population means nothing is changing.” Fix: A near-zero growth rate can hide major changes in aging and workforce share. Why it’s misread: Stability sounds like sameness.
Limits of this explanation: broad rules like “urbanization lowers fertility” are often observed in many datasets, but they are not universal. Outcomes depend on housing, labor markets, education, and local culture, and those drivers can pull in different directions at different times.
Everyday Situations That Make Population Growth Click
Population growth becomes much easier to understand when it is tied to situations people actually notice. These short scenarios show how the same underlying mechanics can appear in daily life without needing technical language.
- School capacity spikes in a district even though families say they are having fewer kids. Why? A large cohort is reaching parenting age, creating momentum.
- Housing rents rise fast in a city while national growth looks flat. Why? Migration concentrates people locally even when the country’s total changes slowly.
- Hospitals expand geriatric services years before the population starts shrinking. Why? Aging can increase service demand even with low growth.
- Job markets feel tight after a baby boom generation retires. Why? The age structure shifted; fewer workers enter as many exit.
- Public transit becomes crowded despite modest national growth. Why? Urbanization and internal migration change density more than totals.
- Consumer goods demand changes (more childcare products, then more eldercare services). Why? The population’s life-stage mix moves in waves.
- Local birth counts stay high even as fertility falls. Why? There are simply more potential parents than before.
A Fast Self-Check
- If a place looks “crowded,” check density and migration, not just national totals.
- If births stay high, ask whether the number of women of childbearing age grew.
- If growth slows, check whether it’s fertility, mortality, or net migration that moved.
Quick Test: Can You Spot The Driver?
Each item below is a realistic sentence someone might say. Open it to see whether it holds up, what it misses, and which population-growth lever is doing the work.
“Fertility fell below 2.1, so the population will start shrinking next year.”
Not necessarily. The population may keep growing for years due to population momentum if there are many people entering childbearing ages. Shrinkage depends on the full balance of births, deaths, and net migration, not a single threshold.
“Two countries both grew 1%, so they added the same number of people.”
False. A 1% increase on a large population adds far more people than 1% on a small one. Rates compare speed; counts describe volume.
“If deaths fall, growth always rises.”
Usually, but context matters. Lower mortality can raise growth, especially when improvements affect younger ages, yet the overall effect depends on fertility trends and whether migration is negative or positive. Timing and age-specific changes matter more than the headline metric alone.
“Migration doesn’t change population growth, it just moves people around.”
Incorrect at the country or city level. Net migration changes the size and age mix of a place, sometimes becoming the dominant driver of growth in low-fertility settings. It also affects future births because it changes how many people are in working and childbearing ages.
“A stable population means the age profile is stable too.”
Not true. A near-zero growth rate can hide rapid aging, where the share of older people rises even if total headcount barely moves. Age structure can shift significantly while totals look calm.
A Clear Way To Read Population Headlines
Population growth is best understood as a system: flows (births, deaths, migration) interacting with a stock (age structure). Once you separate rates from counts and add the age profile, most demographic news becomes predictable.
The most reliable explanations focus on which lever shifted and whether that shift is likely to persist across decades. That approach is more accurate than debating a single number like fertility or a single year’s growth rate.
The most common mistake: treating today’s fertility rate as if it instantly rewrites the population total, while ignoring momentum and migration.
A memorable rule: If you can name the moving lever and describe the age structure, you can explain most population growth stories in two sentences.
Limitations And What We Don’t Know
Population forecasts are informed estimates, not guarantees, because the drivers are sensitive to sudden shifts. Being honest about limits makes the topic clearer, not weaker.
- Fertility can change quickly with economic uncertainty, housing costs, and family policy differences, and these effects are not identical everywhere.
- Migration is volatile and can reverse with labor markets, conflicts, and policy changes, making it hard to project decades ahead.
- Mortality can be disrupted by epidemics, heat waves, or health-system shocks, which can temporarily alter trends.
- Age structure data quality varies by country; inaccurate base data can distort long-run projections.
- Behavioral change (when people choose to have children, not just how many) can shift birth timing and confuse short-term readings.
Sources
United Nations – World Population To Reach 8 Billion On 15 November 2022 [Use this for the 8 billion milestone and the UN’s framing of growth slowdown.] This is reliable because it is an official UN DESA publication based on UN population estimates.
United Nations Population Division – World Population Prospects [Use this for standardized estimates and long-run projections.] This is reliable because it is the UN’s primary, regularly updated global demographic dataset.
United Nations DESA – World Population Prospects 2024 [Use this for recent summary messages and projection context.] This is reliable because it is an official UN Population Division release tied to documented methods.
World Bank Data – Population Growth (Annual %) [Use this for country-by-country growth rates and time series.] This is reliable because it is compiled from internationally recognized sources with transparent metadata.
World Bank Data – Fertility Rate, Total (Births Per Woman) [Use this for TFR comparisons across countries and years.] This is reliable because it aggregates official statistics and UN-based demographic estimates in a consistent format.
World Health Organization – Mortality And Global Health Estimates [Use this for mortality trend context and how deaths are tracked.] This is reliable because WHO produces standardized global health estimates used in research and policy.
United Nations Population Division – PopFacts: Population Momentum [Use this for the formal idea of population momentum and why age structure matters.] This is reliable because it is a UN technical note grounded in demographic accounting.
OpenStax (Rice University) – Biology 2e: Human Population Growth [Use this for a peer-reviewed educational explanation of growth patterns.] This is reliable because OpenStax materials are academically reviewed and openly licensed by a university-based publisher.
Encyclopaedia Britannica – Population Growth [Use this for clear reference definitions and basic framing.] This is reliable because Britannica is a long-standing editorial reference with expert-reviewed entries.
Encyclopaedia Britannica – Fertility Rate [Use this for a reference-level explanation of fertility vs birth rate and the common 2.1 benchmark.] This is reliable because it is a curated reference source with editorial standards.
Oxford Reference – Population Momentum [Use this for a concise dictionary-style definition of momentum.] This is reliable because it is published by Oxford University Press with controlled editorial sourcing.
Our World in Data – Replacement-Level Fertility Rate [Use this to show that replacement levels vary by context.] This is reliable because it documents definitions, sources, and provides transparent datasets curated by a research-linked team.
FAQ
What is population growth in simple terms?
Population growth is the change in the number of people in a place over time. It comes from births, deaths, and net migration, shaped by the population’s age structure.
Why can a population keep growing when fertility is falling?
Because of population momentum. If there are many people entering childbearing ages, total births can stay high for years even when each family has fewer children on average.
Is replacement-level fertility always 2.1?
No. Around 2.1 is a common approximation in high-survival contexts, but the true replacement level can vary with survival rates and sex ratios. It is best treated as a benchmark, not a universal constant.
What is the difference between birth rate and fertility rate?
Birth rate is typically births per 1,000 people in a year, while total fertility rate summarizes childbearing as the average number of children per woman under current age-specific rates. They can move differently when the age structure changes.
How do you estimate how fast a population will double?
A rough shortcut is the Rule of 70: doubling time ≈ 70 ÷ annual growth rate (%). It is an approximation and works best when growth is relatively steady.
What data sources are most trusted for population statistics?
Global estimates often rely on the United Nations Population Division and World Bank datasets, with health and mortality context commonly supported by WHO sources. Using these helps keep comparisons consistent across countries.